 Do you know what your plant zone is?
One of the most important considerations in determining which plants you can grow in your garden is whether or not they will survive the climate in your area; in other words, it depends on what zone you live in. Gardeners need to compare the climate of their garden with the climate that their particular plant of choice grows best in. If you plant a perennial, shrub, or tree, the plant needs to be able to tolerate year-round conditions in our area, meaning the coldest and the hottest temperatures, as well as, the amount of rainfall. Some plants may survive in the cold of winter but are not able to survive summer heat; and others can survive summer heat but cannot survive the winter freeze. Source
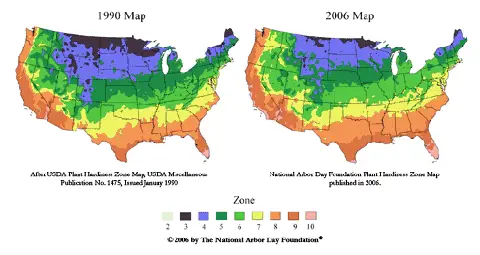
Chances are your plant zone isn’t the same as it used to be. The National Arbor Day Foundation (NADF) updated its hardiness zone map in 2006.
See how the changes look on side-by-side hardiness zone maps:
This animated map shows how the hardiness zones changed. (click Play)
Before that, the flower & plant zone map was based on statistics that were over 20 years old.
Starting with the USDA zone map as a base, researchers examined 15 years of temperature information from the National Oceanic and Atmospheric Administration’s 5,000 climatic data centers across the country. When everything was tabulated, the NADF decided to make some changes. Many areas of the country have moved up a full zone because of temperature changes over this time period. — Source
The NADF Hardiness Zone map now reflects a warmer climate and the latest hardiness zones are based on the most current temperature data available.
Because of this, gardeners will begin to see a wider selection of plants available to them, while some plants that need the colder temperatures of winter will begin to suffer. Overall, the growing season will be longer throughout much of the U.S.
Compare the NADF Hardiness Zone map with the USDA Hardiness Zone map that is based on the lowest temperatures recorded for each of the years 1974 to 1986 in the United States and Canada and 1971 to 1984 in Mexico.
Generally speaking:
- Zone 1 (the coldest) represents Alaska and Canada.
- Most of the United States falls within Zones 2 through 10.
- Zone 11 (the hottest) represents Hawaii and Mexico.
Which Hardiness Zone Map To Use
So, which hardiness zone map should you be using?
Truth is, hardiness ratings alone are inadequate to guide landscapers in selecting the most successful plants.
Regardless of whether you prefer one plant zone map over the other, or you prefer to use both and make your own generalizations, here are some things worth mentioning about the 2 different maps:
Find Your Plant Zone
Plant Maps – find the hardiness zone for your area
NADF Plant Hardiness Zone Lookup – just enter your zip code
Regional Gardening Zone Reports – choose your area, then click Region Description
USDA Plant Hardiness Zone Lookup – just enter your zip code
Another important variable that determines when you should plant is the frost/freeze date for your area. Here’s the frost chart for the United States.


